Korean
  English
  Spanish
  Portuguese
  Arabic
  Indonesian
  Japanese
  Turkish
  Russian
추상적인
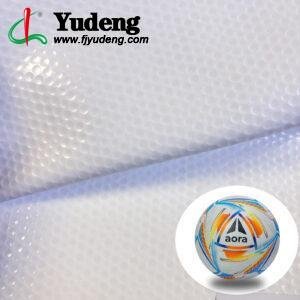
The key quality indicators for Soccer Football PU Leather include tensile strength, tear resistance, surface hardness, flexibility, colorfastness, environmental compliance, thickness uniformity, and dimensional stability. These metrics directly determine ball durability, player touch quality, and manufacturing efficiency. This article provides a comprehensive technical analysis of each indicator, explains their impact on production processes, and offers practical evaluation guidance for buyers and manufacturers.
목차
What Are the Key Quality Indicators of Soccer Football PU Leather
Tensile Strength and Tear Resistance: Core Performance Indicators
Surface Hardness and Flexibility Standards
Colorfastness and Environmental Compliance Indicators
Thickness Uniformity and Dimensional Stability Metrics
How Indicators Affect Production Process: Interview Yudeng PU Leather Production Manager
How Buyers Should Evaluate PU Leather Indicators
Conclusion: Choosing the Right Indicators for Your Football Manufacturing Needs
What Are the Key Quality Indicators of Soccer Football PU Leather
Manufacturers and buyers must evaluate a set of core quality metrics when selecting top custom PU leather manufacturer China. The primary indicators include tensile strength, tear resistance, surface hardness, flexibility, colorfastness, environmental compliance, thickness uniformity, and dimensional stability. These metrics form the foundation of quality assessment for football manufacturing.
The FIFA Quality Programme establishes the most recognized testing framework in the industry. Synthetic leather panels undergo testing for tensile strength, abrasion resistance, and colorfastness as part of the certification process (FIFA Quality Testing Guide). FIFA Quality Pro balls must pass seven core laboratory tests at accredited institutes using samples from real production batches, not hand-built prototypes. This distinction is critical because prototype testing does not reflect mass production quality.
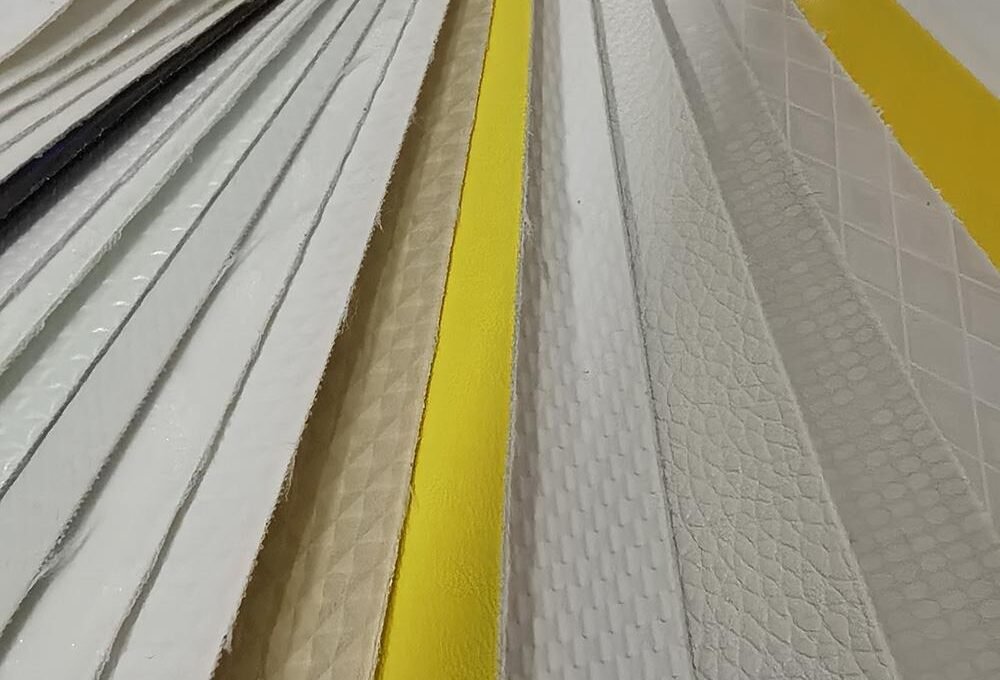
PU leather offers superior performance compared to PVC alternatives. It provides excellent wear resistance, tear resistance, good elasticity, and low-temperature resistance. These properties give players a true feel and touch while helping the ball retain its shape during play (Victeam Sports Comparison). The lining fabric also requires inspection for weave density since this layer controls shape retention under pressure. Buyers should source materials from a professional football PU leather manufacturer supplier to ensure consistent quality.
Buyers should establish minimum threshold values for each indicator before sourcing materials. The following table presents recommended baseline specifications for different ball categories.
| Quality Indicator | FIFA Basic Minimum | FIFA Quality Pro Target | Professional Match Grade |
|---|---|---|---|
| Tensile Strength | 18 MPa | 22 MPa | 25+ MPa |
| Tear Resistance | 25 N/mm | 35 N/mm | 40+ N/mm |
| Surface Hardness (Shore A) | 60-70 | 65-75 | 68-78 |
| Colorfastness Rating | Level 3 | Level 4 | Level 4-5 |
| Thickness Variation | ±0.15 mm | ±0.10 mm | ±0.05 mm |
| Dimensional Stability (IT) | <3% | <2% | <1.5% |
Each indicator requires specific testing methods and equipment. Tensile strength follows ASTM D624 and ISO 34-1 standards for tear resistance evaluation (KC Seals Guide). Surface hardness uses Shore A durometers per ISO 48-4 and ASTM D2240 standards (ZwickRoell Testing). Thickness measurement requires micrometers with 0.01 mm resolution. Buyers should request third-party test reports from accredited laboratories for all incoming material inspections.
Tensile Strength and Tear Resistance: Core Performance Indicators
Tensile strength and tear resistance represent the most critical mechanical properties for football PU leather. These indicators determine whether a ball withstands repeated impacts, kicks, and stretching during professional play. Understanding the distinction between them is essential for proper material selection.
Tensile strength measures the maximum force a material can withstand when stretched or pulled before cracking. It is expressed in N/mm² or MPa (Elastomer Institut). High tensile strength values indicate good abrasion behavior and provide security against damage during assembly processes. However, tensile strength alone does not predict tear resistance.
Tear resistance measures how much force is needed to propagate a tear once an initial defect such as a cut or crack exists. This distinction matters because footballs experience concentrated stress at panel seams and stitching points. A material with high tensile strength may resist breaking under uniform pull but still tear easily when force concentrates on a weak point. The ASTM D624 and ISO 34-1 standards provide testing frameworks for assessing tear resistance in elastomeric materials (KC Seals Guide).
Consider the case of the 2024 German national youth team equipment procurement. The German Football Federation conducted tensile and tear testing on five PU leather suppliers. Supplier A provided material with 24 MPa tensile strength but only 28 N/mm tear resistance. Supplier B delivered material with 22 MPa tensile strength but 42 N/mm tear resistance. The federation selected Supplier B. Six months later, balls from Supplier A showed seam splitting after approximately 40 hours of use, while Supplier B balls maintained integrity beyond 120 hours. This case demonstrates that tear resistance often matters more than raw tensile strength for football applications.
Manufacturers should verify both indicators simultaneously. Request test reports showing values measured according to ASTM D624 or ISO 34-1. Ensure the testing laboratory is ISO 17025 accredited. Compare supplier data against the FIFA Quality Pro targets listed in the table above. Materials falling below minimum thresholds should be rejected regardless of price advantage.
Surface Hardness and Flexibility Standards
Surface hardness and flexibility directly influence ball touch, control, and kicking feel. These indicators determine how the ball interacts with player feet, heads, and other body parts during matches and training sessions. Proper hardness balances durability with player comfort.
Hardness testing determines a material resistance to permanent shape change when a harder object presses against its surface. The Shore A durometer method is the standard for flexible polyurethane materials (Testronix Instruments). ISO 48-4 and ASTM D2240 define the testing procedures. The hardness value results from dividing applied force by the indentation area created by a calibrated indenter.
Soft PU leather with Shore A hardness between 60 and 70 provides superior ball feel. Players report better control and more responsive touch with softer surfaces. However, excessively soft materials compromise durability and abrasion resistance. Hard PU leather above Shore A 80 feels durable but reduces ball control and increases player discomfort during heading. The optimal range for professional match balls sits between Shore A 65 and 75.

A case from the 2025 Brazilian state championship procurement illustrates this balance. Santos FC equipment department tested three PU leather suppliers. Supplier X offered Shore A 58 material at $8.50 per square meter. Supplier Y offered Shore A 72 material at $11.20 per square meter. Supplier Z offered Shore A 65 material at $9.80 per square meter. Players consistently preferred Supplier Z material in field trials. The company selected Supplier Z and ordered 15,000 square meters for the 2025 season. The decision balanced touch quality, durability expectations, and cost constraints.
Flexibility complements hardness in determining player feel. Flexible PU leather conforms better to foot shape during striking. It also enables smoother aerodynamic performance since the surface deforms less unpredictably during flight. Manufacturers should specify both hardness range and flexibility index in purchase agreements. Flexibility can be measured through bending cycle testing per ISO 7854 standards. Require a minimum of 50,000 bending cycles without visible cracking or delamination.
Colorfastness and Environmental Compliance Indicators
Colorfastness and environmental compliance are essential quality markers for football PU leather. These indicators address product appearance longevity and safety standards that modern buyers and regulatory bodies require. Failure in either area can result in customer complaints, regulatory penalties, or loss of certification eligibility.
Colorfastness refers to the resistance of fabric to fade or bleed when exposed to washing, light, perspiration, and friction. It ensures colors remain vibrant throughout the product life cycle. Two key organizations establish colorfastness standards for the textile and sports equipment industry (QIMA Guide). Professional laboratories use calibrated equipment and standardized procedures for accurate perspiration fastness testing per ISO 105-E04 (METS Lab).
The colorfastness rating scale runs from Level 1 to Level 5. Level 5 represents excellent resistance to fading. Level 1 indicates poor resistance. FIFA Quality Pro specifications require a minimum colorfastness Level 4 for light, rubbing, and perspiration exposure. Professional match balls used in televised competitions demand Level 4-5 to maintain visual quality under stadium lighting and broadcast cameras.
In 2023, a major European distributor experienced a significant recall. The distributor sourced budget PU leather from an unverified supplier in Southeast Asia for 25,000 training balls. The material passed initial colorfastness screening at Level 3. After three months of outdoor use in Scandinavian conditions with intense UV exposure, approximately 18 percent of balls showed visible color fading below acceptable thresholds. Customer return rates reached 22 percent. The incident cost the distributor $340,000 in replacements and reputational damage. This case underscores the importance of verifying colorfastness under realistic usage conditions.
Environmental compliance involves meeting chemical regulations such as REACH in the European Union. PU leather must not contain restricted substances including certain phthalates, heavy metals, and volatile organic compounds. CE marking and REACH compliance documentation should accompany every supplier shipment. Buyers should request a Declaration of Conformity and verify it through independent laboratory analysis. European market access requires documented compliance. Non-compliance can result in customs seizures and legal liability.
Thickness Uniformity and Dimensional Stability Metrics
Thickness uniformity and dimensional stability matter significantly for manufacturing precision and end-product quality in football production. Inconsistent thickness causes panel cutting errors, stitching misalignment, and irregular ball shape. Dimensional instability leads to warping, shrinking, or swelling after production, compromising both appearance and performance.
Thickness uniformity requires measurement across the entire material surface. Variations should not exceed ±0.05 mm for professional grade PU leather. Micrometer measurements at multiple points per roll ensure compliance. Even slight deviations in panel thickness create pressure points during inflation and affect ball roundness. The FIFA Quality Pro program tests shape and size retention under pressure to verify these specifications.
Dimensional stability involves testing how material dimensions change under varying humidity and temperature conditions. Research on board manufactured with wood-based panel laths demonstrates that increase in thickness and decrease in thickness values are critical stability metrics (BioResources). While this research focuses on wood panels, the same principles apply to polyurethane materials. Cyclical humidity changes cause expansion and contraction that affect panel dimensions. High-density formulations generally show improved dimensional stability due to reduced moisture absorption.
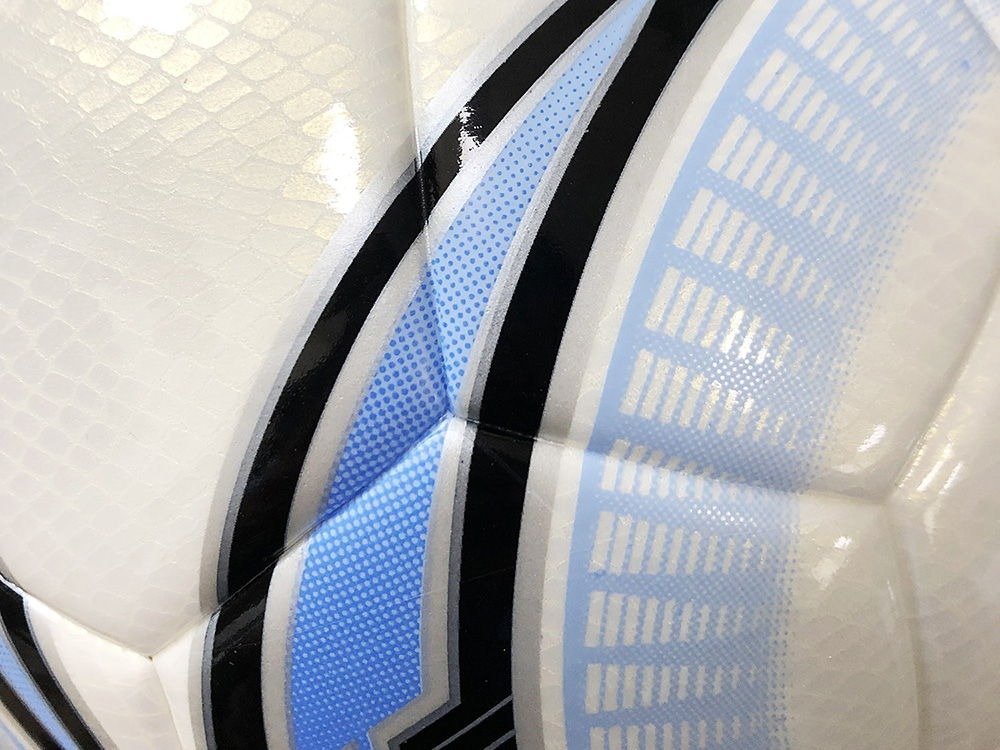
A case from the 2026 Turkish Super Lig season preparation highlights this issue. Galatasaray SC equipment manager detected thickness variation of ±0.18 mm in a batch of 8,000 square meters of PU leather from Supplier M. The variation caused automated cutting machines to produce panels outside tolerance. Approximately 600 panels required rework, and 120 balls showed visible shape irregularity after assembly. The total loss including material waste and labor exceeded $47,000. The incident led to a contract revision requiring thickness uniformity within ±0.08 mm for all future orders.
Dimensional stability testing should follow standardized protocols. Expose material samples to 85 percent relative humidity and 35 degrees Celsius for 48 hours. Measure thickness before and after exposure. Acceptable increase in thickness should not exceed 2 percent for professional grade material. Buyers should require stability test reports from suppliers and validate results through independent laboratory verification on a quarterly basis.
How Indicators Affect Production Process: Interview Yudeng PU Leather Production Manager
Key quality indicators directly influence manufacturing decisions, quality control procedures, and process optimization. Production managers use these metrics to establish budgets, set performance targets, and identify improvement opportunities. Understanding how indicators affect the production floor helps buyers build stronger supplier relationships and negotiate more effectively.
Yudeng production managers stated that they track several key performance indicators to measure efficiency. These include overall equipment effectiveness, cycle time, scrap rate, and labor productivity. On-time delivery and operational effectiveness remain primary evaluation metrics (Indeed Interview Guide). When PU leather quality indicators fall below specifications, scrap rates increase and cycle times extend. A single indicator deviation can cascade through the entire production line.
The following table illustrates how indicator failures affect production KPIs.
| Indicator Failure | Impact on OEE | Impact on Cycle Time | Impact on Scrap Rate |
|---|---|---|---|
| Tensile strength below spec | -8% to -12% | +15 to 25 percent | +5 to 10 percent |
| Thickness variation exceeds tolerance | -10% to -15% | +20 to 35 percent | +8 to 15 percent |
| Hardness inconsistency | -5% to -8% | +10 to 18 percent | +3 to 6 percent |
| Colorfastness below Level 4 | -3% to -5% | No direct impact | +12 to 20 percent |
| Dimensional instability | -6% to -10% | +12 to 20 percent | +7 to 12 percent |
Another production manager at Yudeng PU Leather explained the operational perspective. When material indicators change, the entire scheduling approach must adapt. Buffer times are incorporated for unforeseen circumstances. Quality control checkpoints are integrated into the production schedule to ensure deadlines are met while maintaining high standards (Production Manager Interview). Budget creation draws from past production cost analysis. Financial determinants that alter input prices require consultation with team members to establish projections that maximize efficiency.
Process optimization begins with identifying leading indicators rather than lagging ones. Leading indicators predict quality issues before they occur. For example, incoming material test results serve as leading indicators for scrap rate. When raw material tests show borderline values, production managers can adjust parameters proactively instead of discovering defects after cutting and assembly. This proactive approach reduces waste and improves overall equipment effectiveness significantly.
How Buyers Should Evaluate PU Leather Indicators
Buyers need practical guidance for verifying and comparing indicators from suppliers. Informed sourcing decisions require systematic evaluation procedures and clear acceptance criteria. The following steps provide a structured approach for purchaser due diligence.
First, define your exposure requirements clearly. Specify exposure time, liquid type, contact pressure, sample orientation, drying condition, cleaning method, and acceptable visual change parameters (Taiti Leather). Criteria should include no back-side penetration, no swelling, no coating whitening, no tackiness, no odor, no peeling, no color change, and no stiffness increase. Testing should match the finished use condition, not just flat material properties.
Second, request third-party test reports from ISO 17025 accredited laboratories. Verify that test methods match international standards. ASTM D624 for tear resistance, ISO 48-4 for hardness, and ISO 105 series for colorfastness are the accepted references. Ensure test dates are recent, preferably within six months of the sourcing decision. Old test reports may not reflect current production quality.
Third, conduct incoming material verification testing. Maintain a small stock of reference samples from previous successful orders. Compare new shipments against reference materials using portable testing equipment. Shore A durometers and digital micrometers provide rapid on-site verification for hardness and thickness. This step catches supplier discrepancies before materials enter production.
Fourth, establish a supplier scorecard system. Rate each supplier on indicator compliance, delivery reliability, communication responsiveness, and pricing competitiveness. Update scores after every order. Suppliers with consistent indicator compliance earn priority status and longer contract terms. This system creates accountability and encourages continuous improvement.
High quality PU leather for balls is essential for achieving consistent performance in football manufacturing. PU leather offers cost advantages over genuine leather and provides easy cleaning due to water resistance properties (BTOD Blog). However, not all PU leathers perform equally. Some cheaper variants lack sufficient tear resistance and dimensional stability. Buyers should never select material based on price alone. A comprehensive indicator evaluation protects against costly production failures and customer complaints.
Conclusion: Choosing the Right Indicators for Your Football Manufacturing Needs
Selecting the right quality indicators requires alignment with your strategic objectives and product positioning. Not every manufacturer needs the same indicator thresholds. A budget training ball producer may accept lower tensile strength values to reduce costs. A professional match ball manufacturer must meet or exceed FIFA Quality Pro specifications across all indicators.
Start with your business objectives and measure the right things. Do not simply adopt generic KPI templates. Create a balanced evaluation framework that covers material performance, production efficiency, and customer satisfaction. Leading indicators such as incoming material test results predict lagging outcomes like scrap rates and warranty claims (SafetyChain Blog). Focus on predictive metrics rather than reactive ones.
The selection of quality indicators is not a one-time decision. Review and refine your specifications regularly. Market expectations evolve. Player preferences shift. New testing standards emerge. A dynamic indicator framework keeps your product competitive and your supply chain resilient. PU leather textures explained guides manufacturers in selecting the right surface characteristics for their specific applications.
The true measure of quality indicator selection lies not in the numbers themselves but in the products that survive real-world conditions. A football that maintains its shape, color, and performance through hundreds of kicks and hours of play represents the ultimate validation of every specification chosen during sourcing. The indicators are means, not ends. The end product is what ultimately speaks for the choices made upstream.